
Linia Presentations
Harvey Ball Chart PPT
Harvey Ball Chart PPT
Couldn't load pickup availability
Description
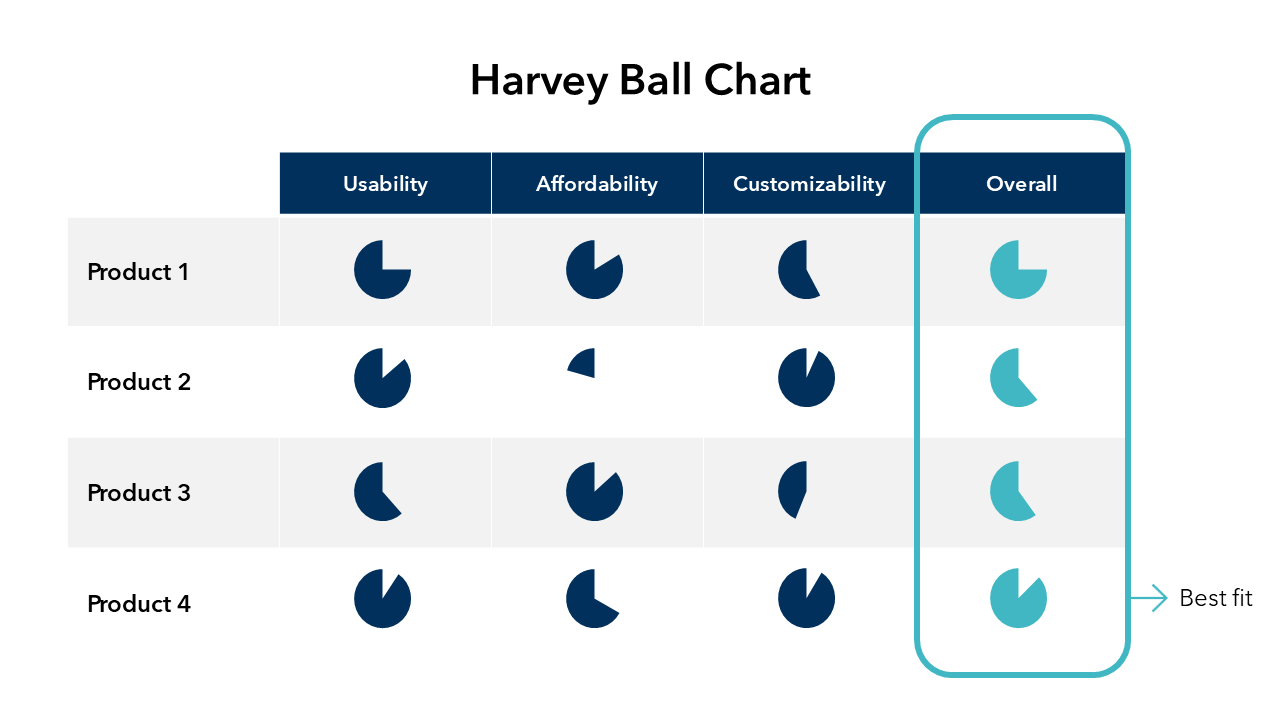
The Harvey Ball Chart uses mini pie charts to show how much each item meets a certain criteria. In this Harvey Ball Chart example, we've also included a final 'Overall' column so you can compare all your items not only per criteria, but also in a holistic way.
Great for visualizing qualitative information which would be hard to describe in text on a single slide.
Easily drag the end point of each pie chart to change its quantity.
✓ All text fully editable
✓ All colors fully editable
Format & Delivery
Format & Delivery
You will receive a PowerPoint (.PPTX) file with this purchase.
If you'd like to use it in Google Slides, simply upload the file into Google Slides, and it'll automatically convert into an editable Google Slides presentation.