
Linia Presentations
Growth Slide Layout
Growth Slide Layout
Regular price
$2.50
Regular price
Sale price
$2.50
Unit price
per
Couldn't load pickup availability
Description
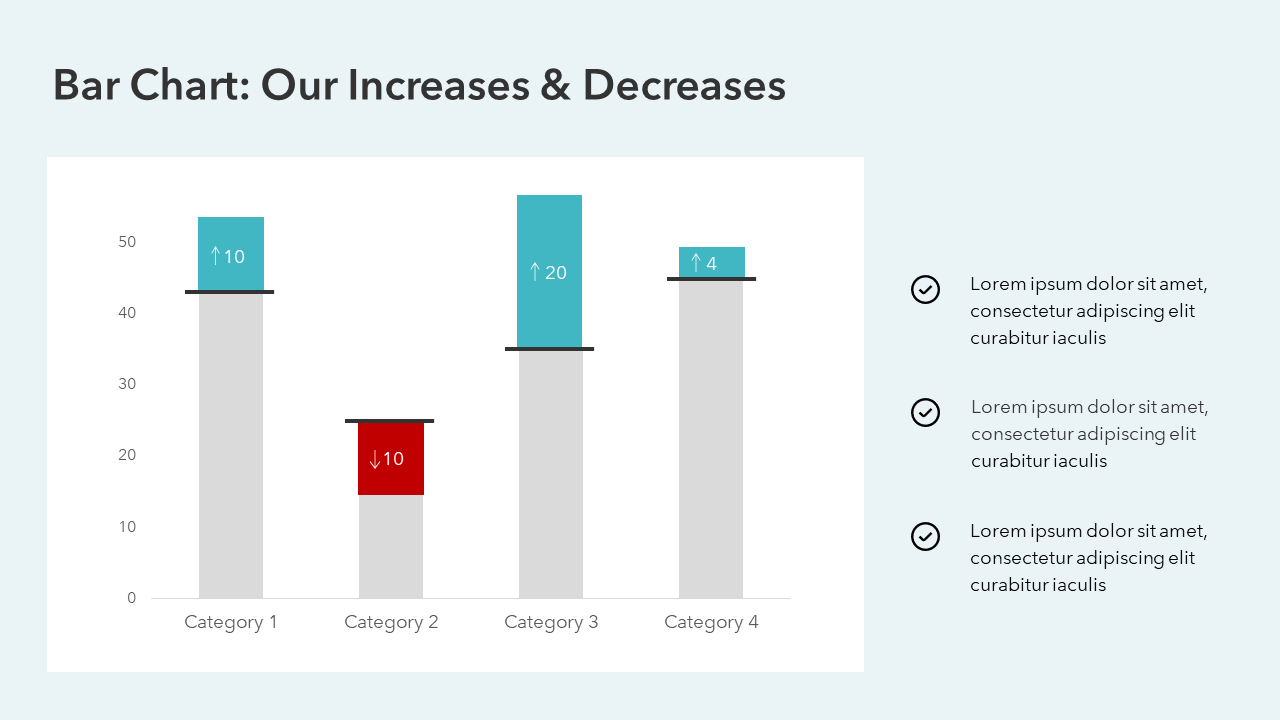
Use this unique bar chart template to show with clarity which areas have grown or increased (and by how much) and which areas have decreased (and by how much).
Use this organized technique to show direction and size of change, rather than separate bars for before and after years.
Your audience will thank you!
✓ All text editable
✓ All colors editable
Tags
money
Format & Delivery
Format & Delivery
You will receive a PowerPoint (.PPTX) file with this purchase. If you'd like to use it in Google Slides, you can easily do that. Simply upload the file into Google Slides, and it'll automatically convert into an editable Google Slides presentation.
Note: If you use Google Slides, the excel charts will be editable in PowerPoint but will export to Google Slides as images.