Linia Presentations
User Demographics Slide
User Demographics Slide
Regular price
$2.50
Regular price
Sale price
$2.50
Unit price
per
Couldn't load pickup availability
Description
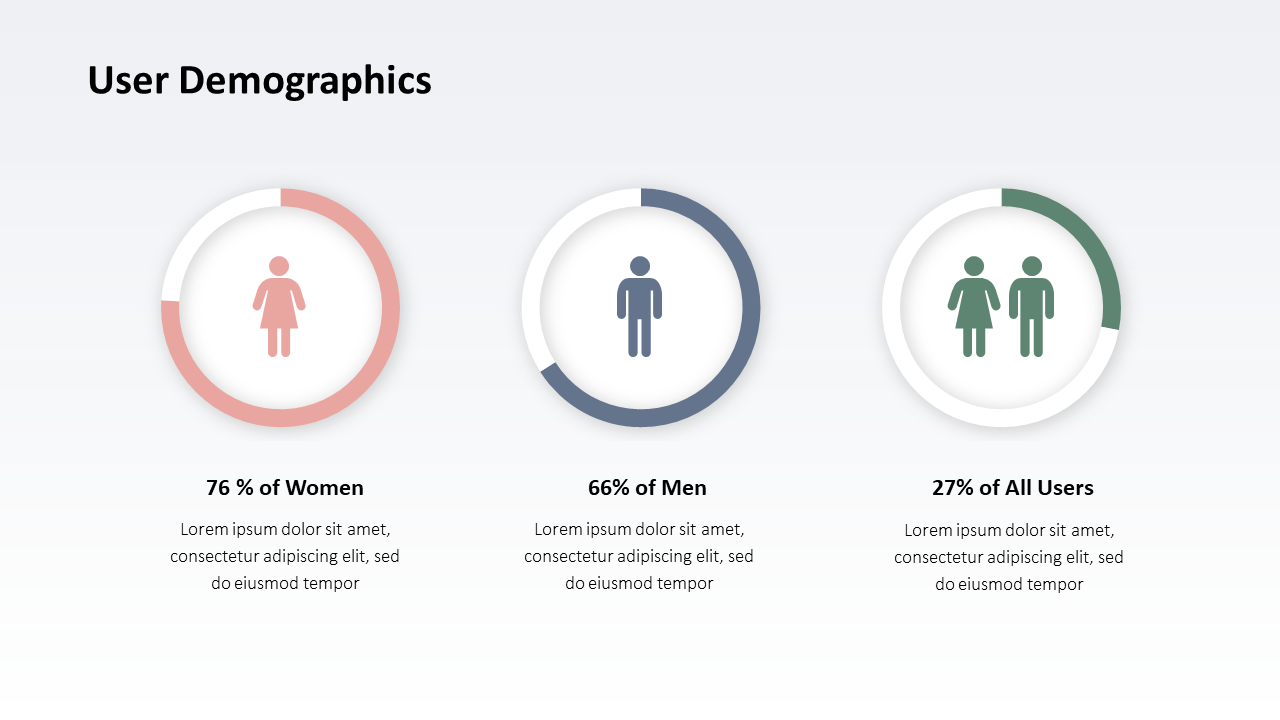
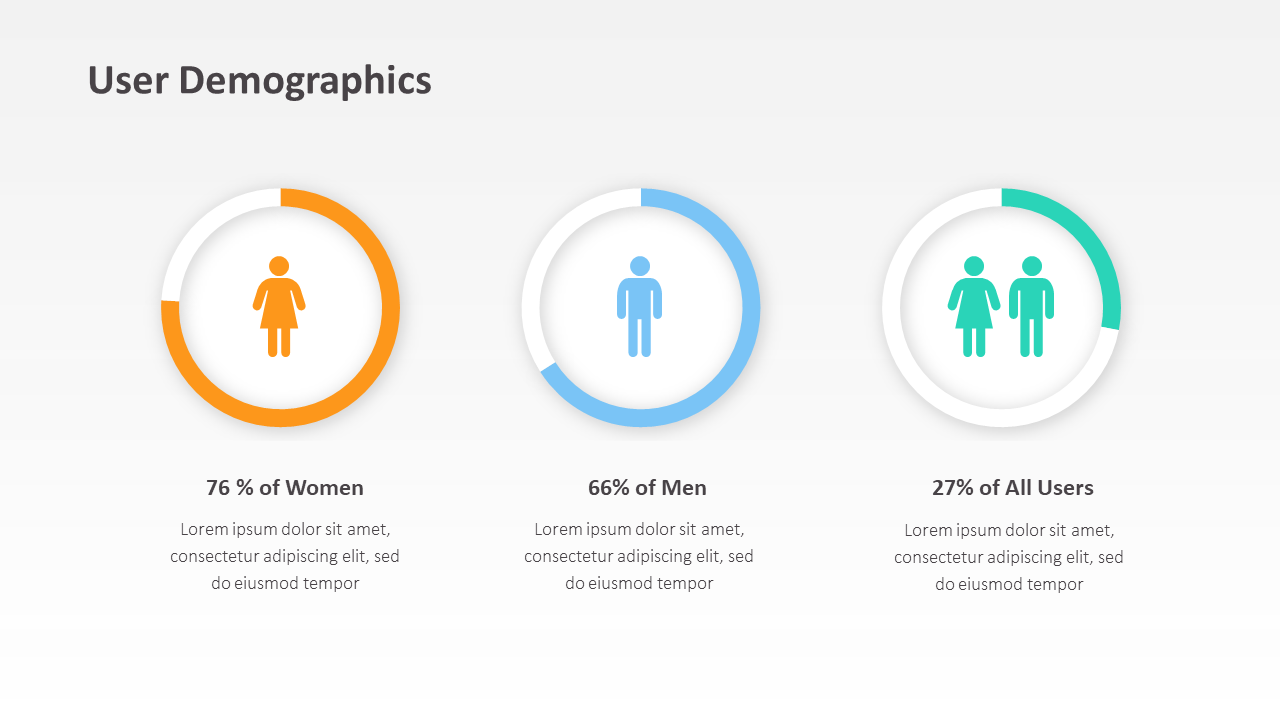
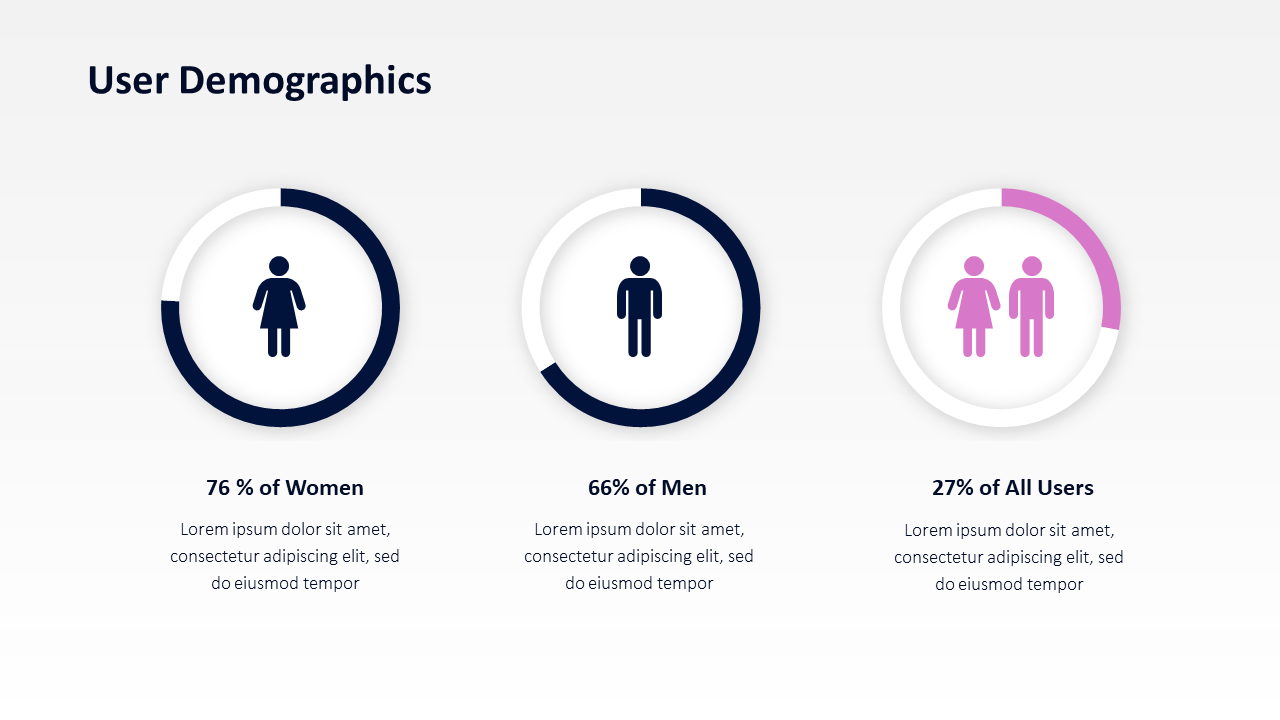
This slide has infographics to display user statistics that vary by gender: men and women. You can use all the stat infographics or delete the ones you don't need.
The number in the percentage circle is an editable chart - just right click and select 'Edit data' to update the percentage amount for each infographic section.
✓ All text fully editable
✓ All colors fully editable
Format & Delivery
Format & Delivery
You will receive a PowerPoint (.PPTX) file with this purchase.
If you'd like to use it in Google Slides, simply upload the file into Google Slides, and it'll automatically convert into an editable Google Slides presentation.


